At Clarity, one of the aims is to make it easy for the users to access and view insight that is important to them! While learning a new system, naming conventions, etc., can be hard! So naturally, it made sense to deeply integrate Google Analytics data into Clarity – Introducing Google Analytics dashboard in Clarity!
If you have already connected your Google Analytics account in Clarity, then you don’t have to do anything! Like magic, Clarity will already show your data! If you still need to set it up, then you can easily do that here.
Once set up the fun can begin! So, let’s get going…
When you click on the Google Analytics vertical, you will already be familiar with the colors, layout, and data! This makes it super easy to take that information, digest it, and translate the what into the why.
Insight you care about
The Google Analytics dashboard in Clarity shows 5 familiar cards:
- Audience overview – total sessions, bounce rate, duration
- Acquisition report – how did your visitors get to your site
- Popular pages – number of views by page
- Session by country – which countries are your visitors in
- Session by device – Desktop, mobile or tablet
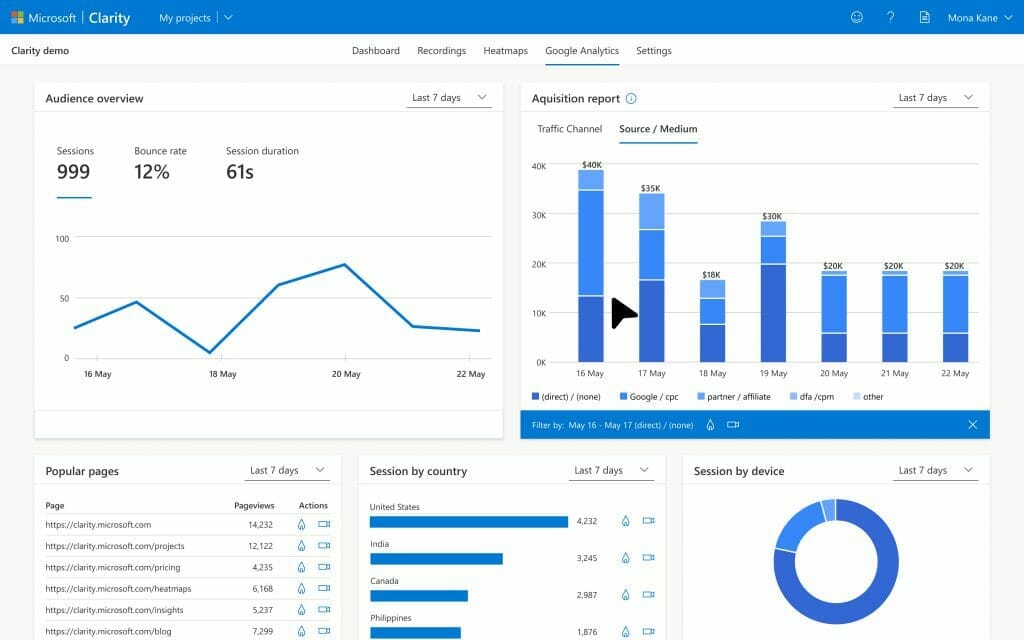
Each card is independent and allows you to change timeframes for each card individually.
Once you see an area of interest, simply select the heatmap or recordings icon and Clarity will automatically create those filters and show you the data.