Google Analytics is one of the best tools you can use to understand how engaged your website audience is.
By looking at the data, you can learn and identify problems and issues that prevent you from successfully engaging your audience.
You can also identify what helps you to improve user engagement.
To be able to do that, you should know what the most important Google Analytics engagement metrics are and how to track them. The easy part, is that Google Analytics is integrated with your Closrr website, you just need to add the tracking code.
Bounce rate
Bounce rate is the percentage of visitors that bounce back (leave) from the first page they visit on your site without exploring it further.
The reasons for high bounce rate could be many – from people arriving on a wrong or unwanted page to web design, usability issues and too many distractions.
It’s important to state that according to Dan Zarrela, exit-intent popups don’t contribute to a higher bounce rate.
In all cases, a high bounce rate is a signal that there is something wrong with your website because your visitors don’t engage by exploring it further.
Bounce rate along with ‘time on site’ are part of dwell time, a metric that affects your search engine rankings.
So a high bounce rate and low time on your site decreases your SERP.
Average bounce rate per industry: KISSmetrics (Neil Patel) made a great infographic sharing the average bounce rate for different industries tracked with Google Analytics:
- Retail – 20 – 40%
- Landing pages – 70 – 90%
- Portals – 10 – 30%
- Service sites (self-service or FAQ site) – 10 – 30%
- Content sites – 40 – 60%
- Lead generation (service for sale) – 30 – 50%
So if your numbers are higher, you know you have work to be done. Or, if you would rather not spend weeks doing so, we can do it for you.
You should know that a high bounce rate is not always a bad thing. Sometimes visitors bounce back because this page gave them exactly what they wanted.
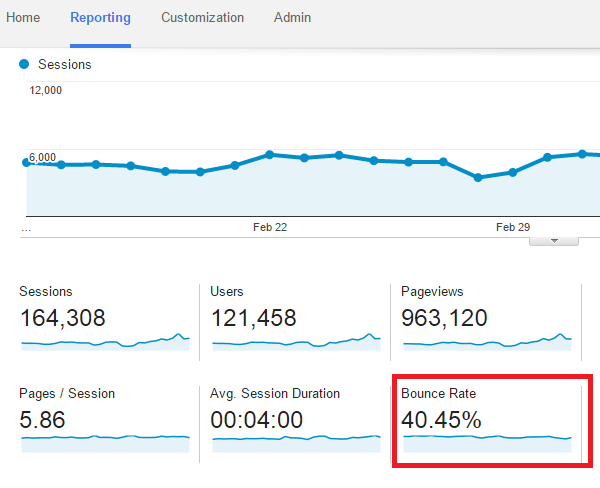
How to track Bounce rate with Google Analytics – to track this engagement metric, go to Google Analytics – Audience – Overview.
If you want to check the bounce rate per traffic channel, go to Acquisition → All Traffic → Channels.
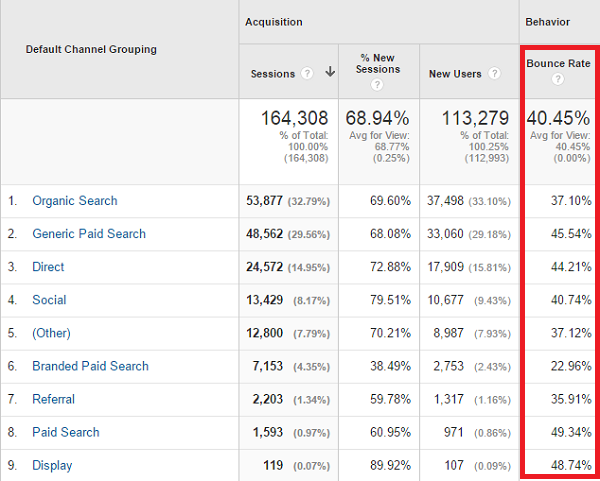
That way you can see that traffic coming from “Paid search” (49.34%) has a much higher bounce rate than “organic search” (37.10%).
Then you can take action to find out why.
In case you want to check out your bounce rate by exact source, go to Acquisition → All Traffic → Source/medium.
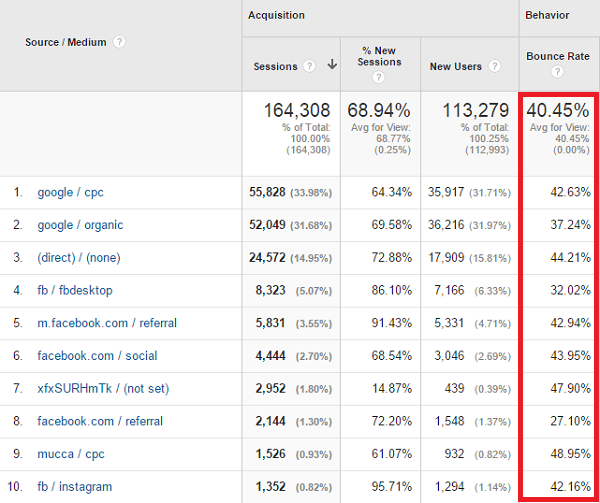
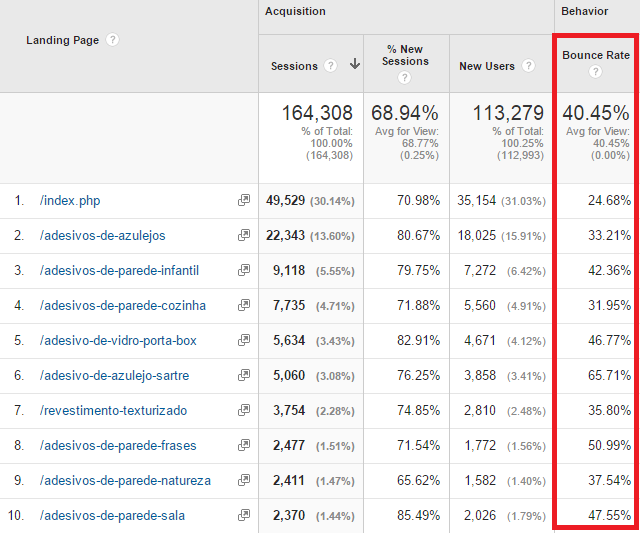
Another way you can measure bounce rate is by landing page. That way you can see which ones are contributing to your high bounce rate, so you can fix them.
Go to Behavior → Behavior Flow → Site Content → Landing pages
Time on site
According to HubSpot, 55% of visitors spend 15 seconds or less on your site.
This points to a huge problem – if people don’t engage with your website, you won’t be able to sell them your goods or services.
That’s why it’s crucial to track this Google Analytics use engagement metric.
And when you find that people are spending too little time on your site, you should use some strategies to increase it.
How to track time on site with Google Analytics – go to Audience → Overview to see the avg. session duration for your website.