Heatmaps can be extremely useful tools. They enable you to track user behavior on your website, in ways that mere numbers often have a hard time representing. With a heatmap, you can visualize your visitors’ journey through your content. This enables you to quickly identify pain points, so you can improve their experience.
Although WordPress doesn’t offer heatmap functionality out of the box, you can easily add it to your website using plugins. In this article, we’ll dig deeper into how heatmaps work, why you should be using one, and what your options are as a WordPress user.
Let’s get to it!
An Introduction to Heatmaps
These days, you can track all kinds of data about how visitors behave on your website. You can see which pages they spend the most time on, what links they interact with, how far down each page they scroll, and much more.
Most of that data comes to you in the form of numbers. In some cases, it can be hard to visualize what it all means. For example, you may know which of your pages are the most popular. However, that tells you nothing about why that particular content resonates with visitors.
Heatmaps enable you to take a different approach, by creating a visual representation for some of your website’s analytics. Most often, that representation comes in the form of an overlay on top of your pages:
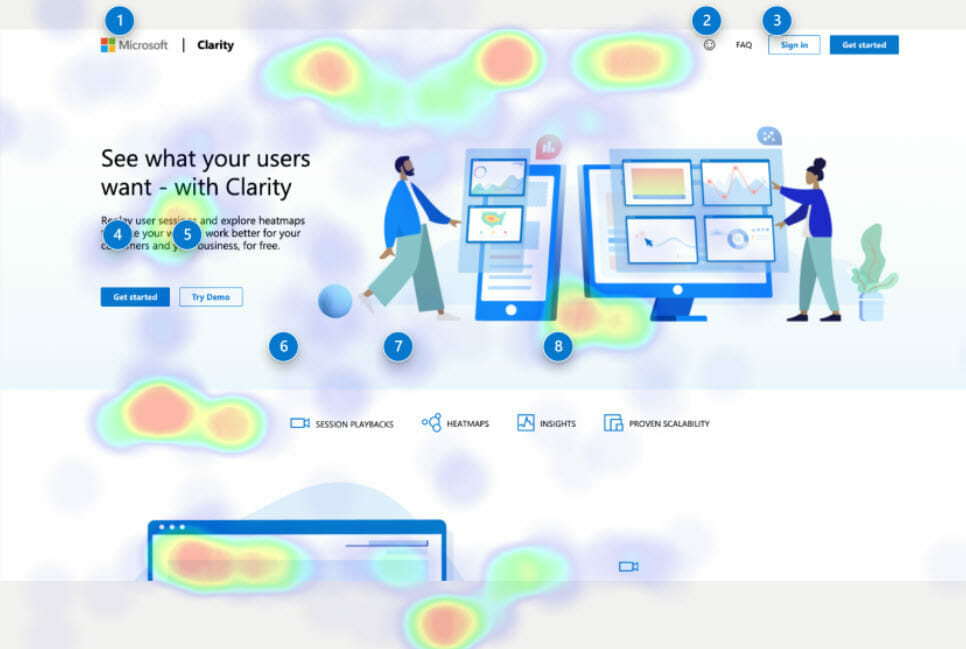
In the above screenshot, you can see that specific areas of the page are highlighted in warmer colors. Heatmaps use a simple color gradient that moves from colder to warmer colors. The ‘hotter’ the color is, the more attention and interactions that specific part of your page is getting.
Most modern analytics tools throw entire libraries of data at you. However, heatmaps enable you to gain a much more intuitive grasp of your users’ behavior. If you can determine at a glance what elements on your pages are drawing the most attention, there are a lot of insights you can glean from that data.
Before we move on, it’s important to mention that heatmaps aren’t just excellent tools for website analysis. Heatmaps are everywhere, from weather reports to statistical analysis, financial market visualization, and more. Those applications make for interesting reading. We’re here to talk about websites, however, so let’s discuss the benefits of that use case.
Why Heatmaps Can Help You Improve Your Website’s Quality
As we mentioned earlier, heatmaps are fantastic if you want to approach web analytics from a different angle. Depending on what information you want to prioritize, there are several different types of heatmaps you can use.
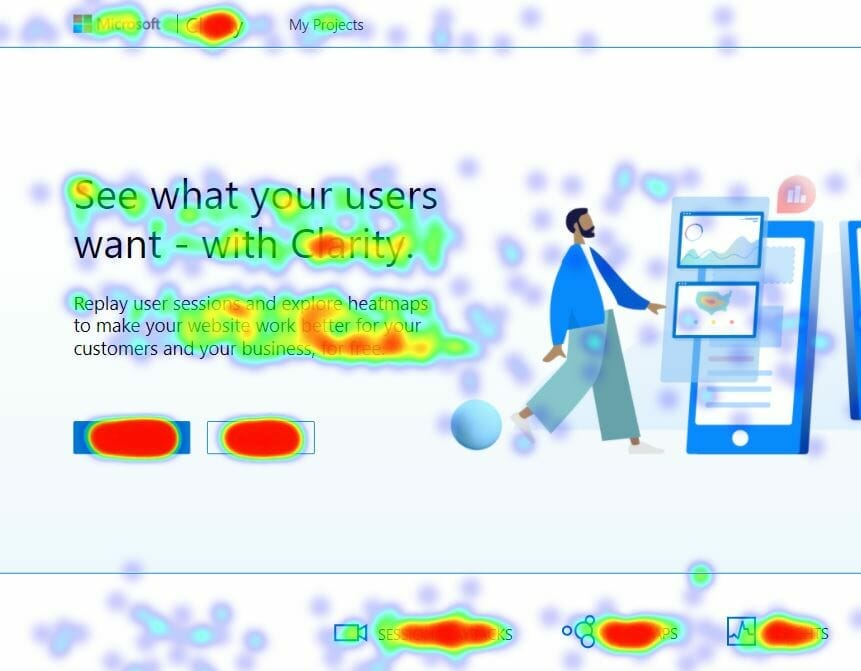
We’ve already talked about click heatmaps. With enough data, click heatmaps can tell you what areas on your pages are ‘hotspots’. Ideally, you want those hotspots to line up with critical elements, such as Calls to Action (CTAs), products, links, and more:
If you don’t see enough activity surrounding key elements on your pages, it can point to User Experience (UX) issues, optimization problems, poor copy, and various other causes. That brings us to a key point – heatmaps don’t tell you exactly what you need to fix. However, they do a great job of pointing you in the right direction. If your newsletter signup button isn’t getting much activity, you know that’s an element that needs to be tested and addressed.
Of course, in order for heatmaps to provide you with accurate information, you’ll need enough data. A handful of visitors is not an accurate representation of your audience. If you’re going to make decisions based on data, it needs to be statistically relevant. Therefore, it’s a good idea to set up a heatmap solution as early as possible. Then, you should give it plenty of time to track user behavior and generate accurate results.
Conclusion
You probably already use an analytics tool to get insight into your visitors’ behavior. Any modern analytics platform gives you access to so much information, that it can be hard to interpret. Heatmaps help you take that data and make sense of it, in a more interactive and visual manner than charts or graphs.
If you’re already using Google Analytics, the bad news is that the service doesn’t provide heatmap functionality out of the box. The good news is that to get access to heatmaps for your Closrr website, you have a Heatmap solution integrated, that is simple to set up and use.
Have you used any heatmap tools on your website, and what was your experience like? Let’s talk in the comments section below!